
Pomerol Partners creates and delivers meaningful data-driven business solutions and services. We’ve been operating in Data Analytics and Intelligence Reporting for over 6 years. We are well regarded for creating and deploying solutions geared towards the Hospitality and Tour Operator Industry.
We are based in the United Kingdom, United States and South Africa – implementing solutions on 5 Continents.
We have worked with Travelogic clients for over 3 years and have delivered a powerful suite of analytics designed to help you make sense of your millions of rows data. Our solution is cloud based and built on the award winning Qlikview platform – our existing clients logging in daily to pull reports, analyse trends and make better business decisions.
Given the Covid-19 cloud that currently hangs over the industry we have partnered with Travelogic to make this platform available to all Travelogic clients on a free and no-obligation basis for the next 6 months.
Below is an abbreviated sample and overview of the analytics available.
Please contact us for more information on how to get started with Qlikview and Travelogic.
Kindest regards
The Pomerol Team
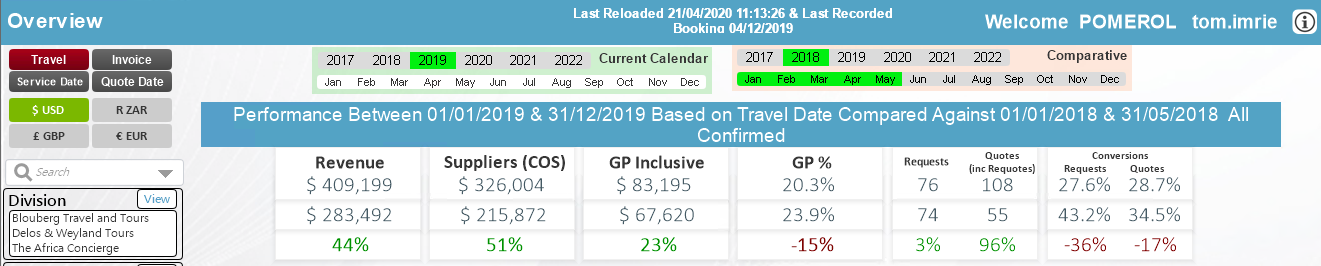
Easy to use overview KPIs when reporting for time frames based on:
- Travel date Reports based on itinerary start date
- Invoice date Reports based on when the invoice was created
- Service date Reports based on services / activities by day
- Quote date Reports based on the date the quote/request was generated

Here you can build reporting tables for, Divisions, Clients, Suppliers, Consultants, Service types or a combination of them all. There are a variety of dimensions and expressions to help you build your reports and a dual calendar format for building comparisons. Multiple filters can be applied to drill down into any part or segment of your business. (The tables can easily be transferred to Excel.)
Aside from Revenues and Profitability the analysis can include Pax Counts and Distributions, Room Nights, Conversion Rates and Requote statistics.
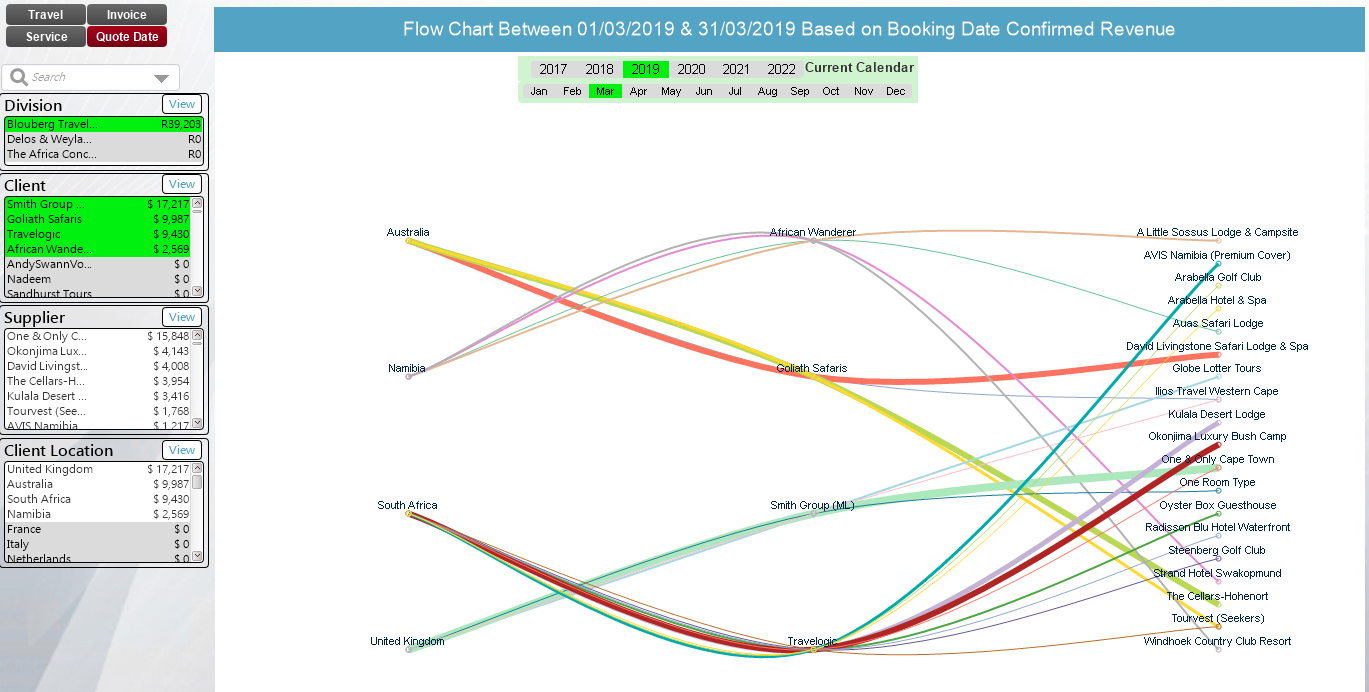
Visual flowcharts.
This example shows where the clients are from, who they booked through and what was on their itinerary.
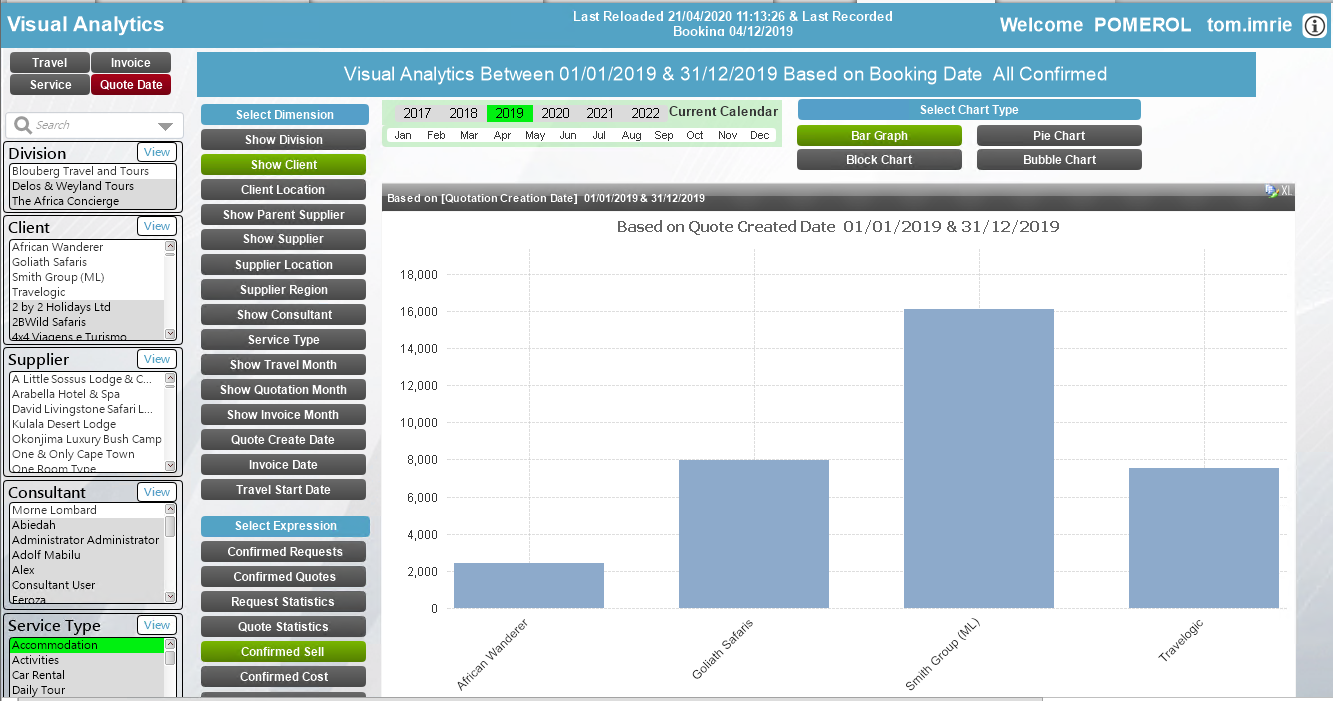
Choose between Bar, Pie, Block or Bubble Charts, to help build effective visualisations.
Multiple dimensions and expressions and click and drag Calendar for filtering dates.
(All graphs can easily be transferred to excel)